
A strong 2014 Q2 GDP report came out yesterday, registering 4% annualized real GDP growth, better than what we have seen in several years. This is good news, but it is worth looking at it in the context of the full recovery of the US economy. The House of Debt Blog has a chart showing recoveries after every post WWII recession in the US, updated to include Q2, 2014:
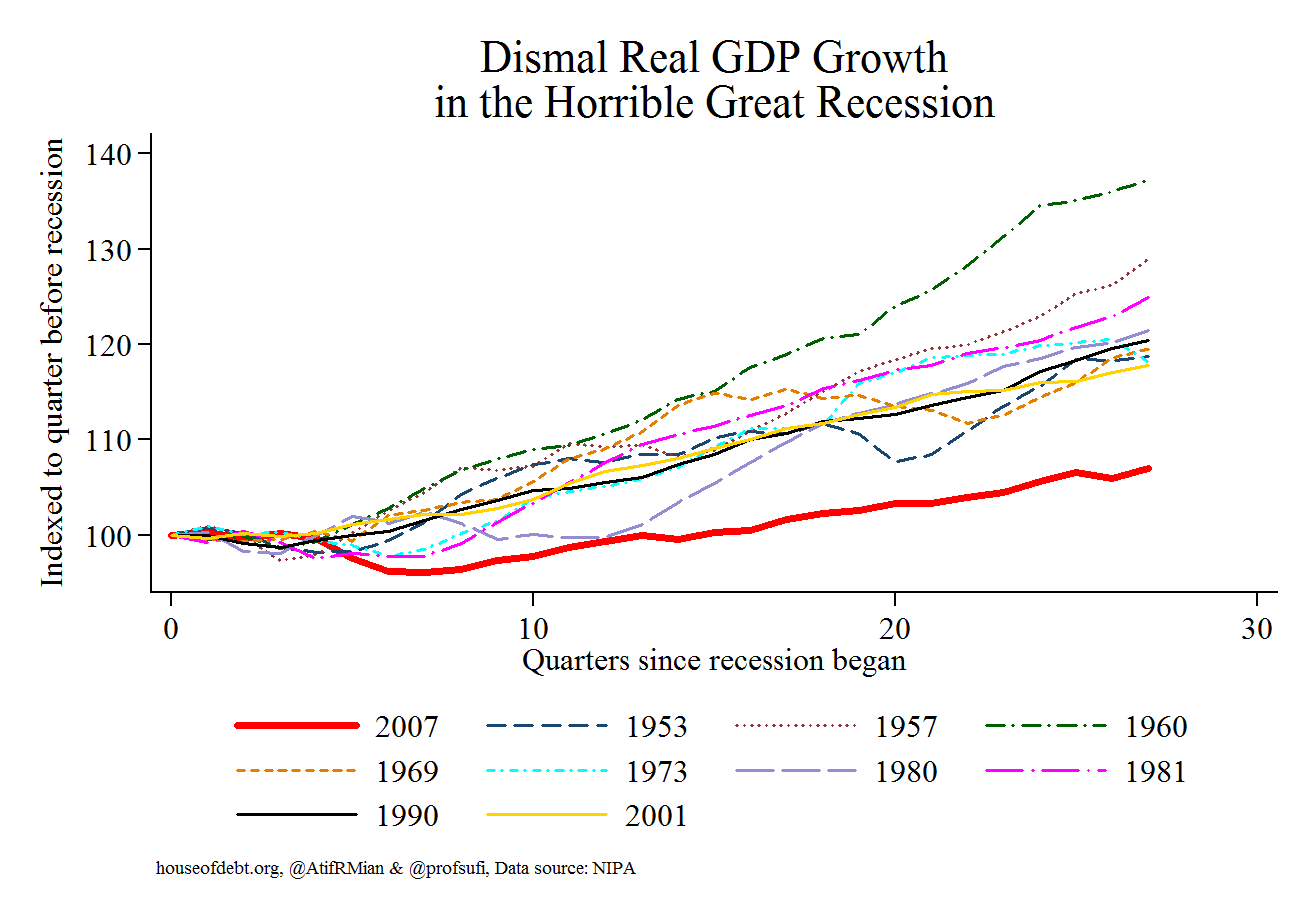
The red line is the Great Recession, compared to our recovery from 9 other post-war recessions. The slight uptick at the end of the red line reflects yesterday’s GDP report. Despite this recent fun news, we remain in the weakest economic recovery in history. Reportage from the New York Times:
The US economy rebounded in the spring after a dismal winter, the Commerce Department reported on Wednesday, growing at an annual rate of 4% for the three months from April through June.
In its initial estimate for the second quarter, the government cited gains in personal consumption spending, exports and private inventory investment as the main contributors to growth. The increase exceeded economists’ expectations and further cemented their views that the decrease in America’s overall output during the first quarter was most likely a fluke tied in large part to unusually stormy winter weather as well as other anomalies.
The NYT says that first quarter numbers were also adjusted upward:
During the first quarter, output shrank by 2.1%, less than had been reported, according to the Commerce Department’s newly revised GDP figures, also released on Wednesday. The department had previously said first-quarter output decreased 2.9%.
Now for the issues in the data: (emphasis by the Wrongologist)
While the economy seems generally to be bouncing back from the recession, overall growth remains lackluster. Wages have failed to rise significantly, an area of concern that Janet L. Yellen, chairwoman of the Federal Reserve, noted when she appeared before Congress this month.
In fact, Doug Short at the DShort blog provides a very helpful series of charts on wages and hours for the private workforce. The Bureau of Labor Statistics (BLS) has been collecting these data since 1964. The BLS numbers provide excellent insights on the income history of the private middle class wage earner. First, average hourly wages adjusted for inflation have remained unchanged since the Nixon Administration:
But that isn’t the bad news. Average weekly hours worked have been declining since the Johnson Administration:
Finally, DShort multiplies the real average hourly earnings by the average hours per week. This produces a hypothetical number for average weekly wages of this middle-class cohort, currently at $694 — well below its $827 peak back in the early 1970s:

$694 per week equates to a $36,000 annual wage. Then the person has to pay taxes, social security, rent, etc. So, purchasing power has declined for the middle class worker. Tomorrow, the July Jobs Report comes out. Then we’ll see if the fun times continue.
In a consumer-driven economy where wages have failed to rise, there can be no sustained economic growth. Media reports say that the economy “rebounded”, that it “exceeded economists’ expectations”. But have economic conditions for average people improved? No, for them, this is a paper rebound, not a real one.
Tracking the economy of ordinary people continues to go unremarked and untargeted by lawmakers. The economic health of average people is an afterthought to the politicians, who consider it a vague byproduct of ‘GDP’ and ‘growth’. In the real world, GDP growth does not directly correlate with improvements in the average person’s well-being.
Workers desperately need more hours at better paying jobs. How does prosperity return if wages stagnate while wealth concentration continues?