
The Daily Escape:

Sunrise in Monument Valley, UT – photo by therealmindzeye. Note the sun star!
Happy tax day! Here are the updated COVID-19 seven-day results as of 4/13:
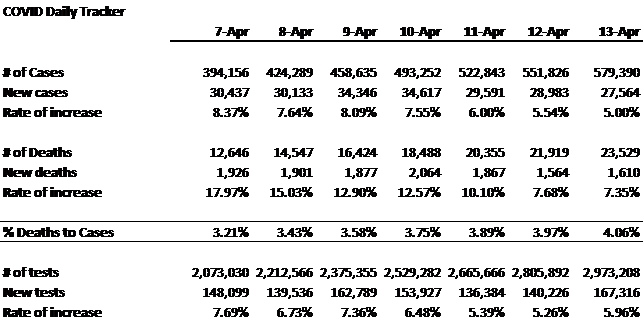
- The number of new cases has plateaued. The average rate of increase for the past seven days is 6.88% vs. 5.00% on 4/13. But, this is a function of how many tests are conducted.
- The number of deaths is increasing more slowly, averaging 11.94% for the past seven days vs. 7.35% on 4/13.
- More people were tested on 4/13 than on any day in the past seven days, but we still lag April 4th, which was the country’s high point in tests at 229,268.
We all hear the daily recitation of new cases, deaths and tests, but as Wrongo said last week, there are multiple issues with the data that politicians and public health officials are relying on for decision-making.
Cathy O’Neil, who writes at Bloomberg and blogs as the Mathbabe, has a column addressing reasons to doubt the COVID-19 data. Here are a few of her points: (emphasis and brackets by Wrongo)
“1. The number of infected is close to meaningless. Only people who get tested can be counted, and there still aren’t enough tests…anecdotal evidence suggests that people need to be ill enough to be hospitalized [to get tested]. About 10% of cases merit hospitalization, so the actual number of infected might be about ten times larger than what’s reported.
2. The tests aren’t accurate and the inaccuracies aren’t symmetric. In particular, they produce many more false negatives than false positives….Some research suggests that the false negative rate could exceed 30%.
3. The number of tests doesn’t equal the number of people tested. Because the tests are so inaccurate, some people get tested twice….This means that the share of the population tested compared to the number of people found to be infected paints a rosier picture than reality…another reason to believe that the actual number of infected is higher.
4. The numbers aren’t in sync. People sometimes die weeks after being hospitalized, and they get hospitalized a week or more after testing positive for the virus. So we shouldn’t expect the “number of deaths” curve to flatten until pretty long after the “number of cases” curve does.
5. The meaning of hospitalization is changing. Officials have recently presented flattening hospital admissions as a positive sign. But it takes a lot more to get somebody to the hospital these days. Hotlines are jammed, ambulances are scarce, standards for who gets hospitalized have drastically changed, and people are avoiding overwhelmed emergency rooms. So fewer hospitalizations doesn’t necessarily mean that the situation is getting better.
6. Deaths aren’t reported immediately or consistently. Various operational issues, such as paper filing and notifying next of kin, determine when a death actually gets registered. This might help explain why the most deaths tend to get reported on Tuesdays.
7. Deaths outside hospitals aren’t being reported. When people die at home or in nursing facilities, veteran homes, or prisons, they’re not always counted…..When France started reporting fatalities in nursing homes, their death count increased by 40%. Belgium reports nursing home deaths pretty well, and they’re finding 40% of deaths occur there.
8. The policy for attributing deaths isn’t consistent. Once somebody is gone, why waste a valuable test? So doctors might not mention Covid-19 as a contributing cause. It’s a judgment call, especially when someone was sick already. This might have a very large effect on the data in certain environments like rehab facilities and nursing homes.
9. Officials may have incentives to hide coronavirus cases. China, Indonesia and Iran have all come under scrutiny for their statistics…..So don’t assume that officials are above…manipulation.
10. What happens in one place, or on average, might not be applicable everywhere. Some small studies suggest that the Covid-19 mortality rate is about 1% of the infected population. But that doesn’t mean it will be the same in the US, or in New York City….As we’ve seen in recent days, such disparities are disproportionately affecting people of color.”
You should follow the Mathbabe. We all rely on the count, but as Cathy says, we may not know the true numbers for some time. Testing needs to be done systematically, particularly on asymptomatic people, once we decide to end the lockdowns.
For deaths, accurate numbers may never be available. It’s possible to estimate using the number of unexpected deaths compared to a year earlier. But even that’s not ideal, because lockdowns might suppress other kinds of deaths — traffic accidents, for example — since people are forced to stay at home.
Despite flaws in the data reporting, we’re all obsessed with learning how America is responding to the pandemic. And the daily updates on tests, cases, and deaths gives us a reasonable clue about what to expect, when things might get better, or how our leaders are doing with the response to the virus.