2020 Election Shows Our Economic Divide Worse Than Our Political Divide

The Daily Escape:

Faery Falls near Mt. Shasta CA – November 2020 photo by Gary German

(There will be zero to light posting for the rest of the week. We all need a break from the Turkey of an administration that we’ve endured for the past four years, and this Turkey of a Year.)

The presidential transition is officially underway, nearly three weeks after the election. Despite all of our anxious uncertainty, with almost all the votes counted, it’s safe to say the Biden vs. Trump contest wasn’t close. The Electoral College appears to be holding at: Biden 306 vs. Trump 232, a 57% to 43% win.

There are apparently still about 1.3 million votes to count, mostly in NY. Imagine the drama if NY was the state that winning the election hinged on – we’d all be too drunk to carve the turkey!

If we extrapolate the current margins to the votes that remain, it will look like this: The total Biden vote: 80.6 million; the total Trump vote: 74.4 million; the total minor party vote: 3 million, and the total national vote: 158 million. That means nationally, turnout was about 66%, up from 59% in 2016 and that Biden’s popular vote margin will be 51% to 47%.

There was a more interesting margin of victory: Brookings Metro, part of the Brookings Institution, graphed the roughly 500 counties Biden won against the roughly 2,500 counties Trump won, comparing them by economic output. Here is their map of America’s voting, shown as a chart of relative economic output:

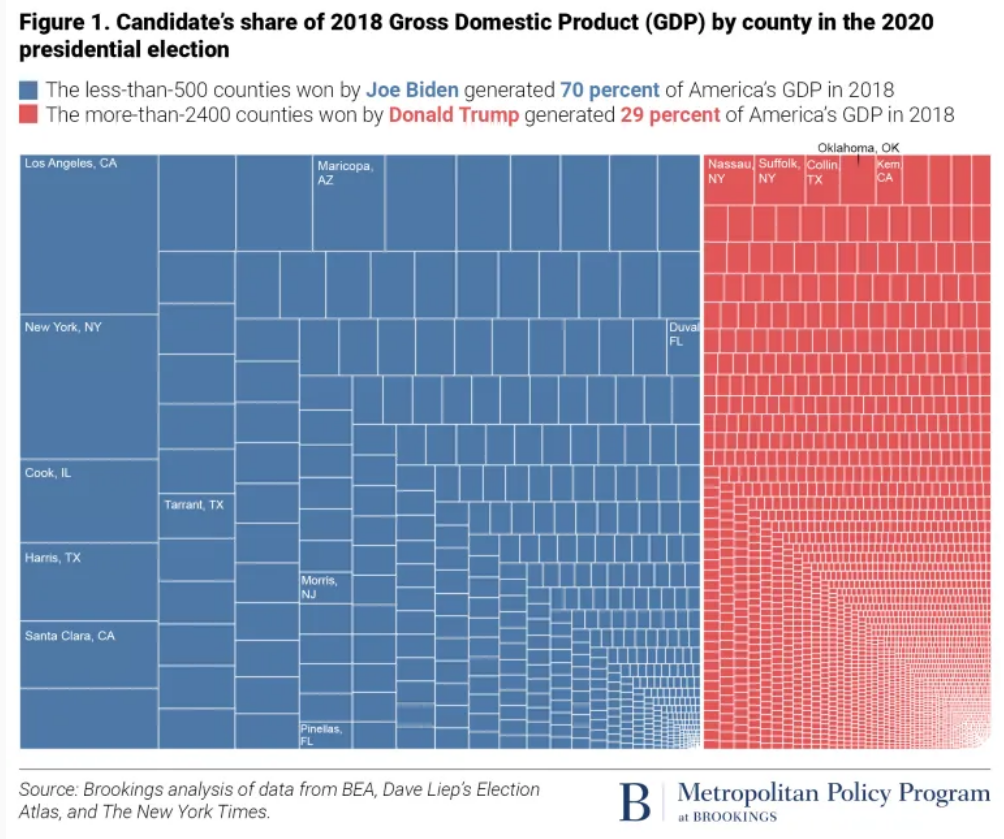
This is pictured as a typical Red vs. Blue breakdown, but it’s not about voting. It’s about that portion of the US economy that voted for the two candidates. Seventy percent of America’s economy is generated in the 500 counties Biden won; the 2,500 counties won by Trump produce just 29%.

Back in 2016, Brookings found that the 2,584 counties Trump won generated 36% of the country’s economic output, while the 472 counties won by Hillary Clinton were about 64% of the nation’s economy.

So there are two conclusions: First, the concentration of economic power has increased significantly in the past four years. Second, a real polarization in America is between its two economies.

Blue and Red Americas reflect two very different economies: The Blue one is oriented towards diverse, often college-educated workers in professional and digital services occupations, while the Red leans whiter, less-educated, and more dependent on “traditional” industries, such as mining, manufacturing and farming.

From Brookings Metro: (brackets and emphasis by Wrongo)

“…notably, Biden flipped seven of the nation’s 100 highest-output counties, strengthening the link between these core economic hubs and the Democratic Party. More specifically, Biden flipped half of the 10 most economically significant counties [that] Trump won in 2016, including Phoenix’s Maricopa County; Dallas-Fort Worth’s Tarrant County; Jacksonville, Fla.’s Duval County; Morris County in New Jersey; and Tampa-St. Petersburg, Fla.’s Pinellas County.”

Still, Trump’s winning of 74 million votes suggests that 47% of us continue to feel little connection to the nation’s core economic future. This may also help explain why Democrats lost all of the 27 toss-up races in the House and Senate.

If this pattern of one Party attempting to confront the social and economic challenges of a majority of Americans while the other Party stokes the hostility and indignation of a significant minority being left behind, we’ll continue to have not just gridlock, but sustained harm for people and towns throughout America.

The Brookings map shows that wealth and power are not only concentrated, but that the concentration is continuing to grow.

If we fail to build an economy for all, it’s possible that at some point the inequality will reach an extreme. What plays out after that is anyone’s guess.

Facebooklinkedinrss

Fed Study Shows Rising Financial Desperation in Poorer Zip Codes

The Daily Escape:

Aliso Creek State Beach, near Laguna Beach, CA – 2019 photo via

Simon Johnson observes at Project Syndicate: (emphasis by Wrongo)

“To defeat populism requires coming to grips with a fundamental reality: bad economic policies no longer necessarily result in a government losing power. In fact, it is now entirely possible that irresponsible populists may actually strengthen their chances of being re-elected by making wilder and more impossible promises – and by causing more economic damage.”

Johnson, former chief economist for the IMF, believes that structural economic factors, including automation, trade, and the financial crisis have left many people feeling neglected by those who control economic policy.

When politicians back policies that add economic uncertainty, or that discourage investment, we see lower economic growth, and fewer good jobs. Ordinarily, dissatisfaction shows up at the ballot box, holding that government accountable at election time.

But this is no longer reliable, because politicians wiggle out of the trap by saying that the media are biased, that the experts are wrong, and that the facts are not the facts. And the angrier people become, the easier it is to persuade them to accept that no one is to blame, and vote again for those who helped to cause their economic distress in the first place.

A new study by the St. Louis Federal Reserve Bank examined American financial distress by Zip Codes. It sheds light on a topic we regularly debate: Why are there so many signs of distress in a supposedly robust economy? And this time, will politicians be held to account?

Since 2015, the lowest income households have been taking on more debt. Their wealth has become even more concentrated in home ownership. The level of distress in lower-income households has also increased, despite the official story of increasing prosperity.

The study drills into Zip-Code level data to show that even adjacent Zips show striking divergence in wealth accumulation (or erosion). For instance, they looked at the percentage of people within a Zip Code that have reached at least 80%t of their credit limit on their bank-issued credit cards.

That is believed to be a good proxy for financial distress.

Before the 2008 crisis, analysts missed the rising levels of household debt. That debt was often funded by borrowing against home equity. Rapidly falling home prices after 2008 showed how fragile many of those borrowers were.

The contrast between national averages and Zip Code households is stark. Looking at averages, the recovery appears to be quite broad.  But zooming in by Zip Code showed a bifurcated economy still suffering from the 2008 crisis. The researchers found that looking at the value of assets and reliance on debt shows a clearer picture: (emphasis by Wrongo)

“…the poor and high-leverage ZIP codes that are more affected by wealth shocks may still be vulnerable. What’s more, trends in less affluent groups are masked in nationally aggregated statistics by groups with more wealth.”

“May be vulnerable”? They will certainly be vulnerable when the next downturn begins.

Since 2015, debt and financial distress have been rising the fastest in these low-wealth areas, while it rose the slowest since 2015 for the wealthiest households. We already see softness in economic indicators like retail sales, home sales and housing construction. It’s reasonable to expect that the next recession isn’t far away.

We’ve had a long economic recovery, but its gains were not distributed as broadly as they had been in previous downturns. What we got was an uneven economic recovery, with most gains going to an increasingly narrow group.

More people are left out of this supposedly robust economy than the politicians and most economists think. The Fed study shows that the averages conceal plenty of pain. Maybe this isn’t an earthshaking idea. We all see income and wealth disparities in our communities, it’s not that unusual. But the fact that the differences are now extreme enough to show up in ZIP Code level data seem significant, and worrying.

So, will politicians pay any price in 2020 for the continuing maldistribution of gains since the 2008 recession? Or, will politicians tell the people that no one’s to blame, that the Laffer curve will surely work this time?

The miracle of modern Republican economic theory allows for both the Laffer curve, and “pulling oneself up by the bootstraps” not only to be truths, but to be the desired outcome.

Facebooklinkedinrss

GOP Asks “Hillbilly Elegy” Author To Run For Senate

The Daily Escape:

Snow in the Sahara Desert, Algeria. The snow lasted only a few hours on the ground, since the average low winter temperature is 54°F – 2018 photo by Zinnedine Hashas

With the speculation about Oprah as a candidate, we knew it wouldn’t be long before the Republicans dredged up a celebrity non-politician too. Politico is reporting that Mitch McConnell wants JD Vance to run for the Senate in Ohio against Dem incumbent Sherrod Brown:

Top Senate Republicans have quietly reached out to J.D. Vance — the star author of “Hillbilly Elegy” — about running for Senate in Ohio after the abrupt withdrawal of GOP candidate Josh Mandel last week… McConnell has told associates that he would prioritize the race if Vance jumps in.

McConnell has a good idea. If Vance runs, he is interesting enough to force Democrats to defend an otherwise safe Senate seat. People seem to think Vance is a white working class whisperer.

Wrongo and Ms. Right were persuaded by many Eastern Liberal Elite friends to read Mr. Vance’s book. The pitch was that Vance explains to liberals why white Trump voters from southeastern Ohio and West Virginia wouldn’t vote for Hillary, and don’t lean progressive in their politics.

Maybe. Wrongo thinks that by writing his book, JD Vance was just pushing propaganda that fits the policy preferences of leading Republicans. Try reading this:

We spend our way into the poorhouse. We buy giant TVs and iPads. Our children wear nice clothes thanks to high-interest credit cards and payday loans. We purchase homes we don’t need, refinance them for more spending money, and declare bankruptcy. . . . Thrift is inimical to our being.

Or, this:

We choose not to work when we should be looking for jobs…

Vance’s stereotypes are shark bait for conservative policymakers. They feed the mythology that the undeserving poor make bad choices and are to blame for their own poverty, so why waste taxpayer money on programs to help lift people out of poverty? After all, Vance got out of hillbilly Ohio without them.

People shouldn’t decide policy based on Vance’s anecdotes; they should care about the bigger picture. After all, are conversations with cab drivers a sound basis for economic and geopolitical policy?

It is depressing that Vance places so much blame on welfare rather than, say, neoliberalism and corporatism. They are the ideologies that moved jobs offshore. Their firms leveraged, and later bankrupted manufacturing firms in the heartland. They are the ones who precipitated the economic holocaust in Middle America.

And despite what Vance tells us, most poor people work. Of the families on Medicaid, 78% include a household member who is working. People work hard in jobs that often don’t pay them enough to live on.

After graduation from Yale, JD Vance became a venture capitalist. First, he worked in Silicon Valley for Peter Thiel, and now works for Revolution LLC, a Washington, DC-based venture capital firm, co-founded by AOL founders Steve Case and Ted Leonsis.

It is fair to say that Vance’s hillbilly days are way back in the rear-view mirror. Yet, he remains naïve. He was on “Face The Nation” on December 31st, talking about the Trump tax cut:

When the president talks about tax reform, he talks about the people who will benefit…He talks about American jobs. He talks about the fact that we’re going to be taking money that’s overseas and bringing it back to the US so that it will employ American workers. I think that focus again on the American working and middle class is- is-is to me the most thoughtful and, in some ways, the most genius part of Trump’s approach to politics.

Vance just revealed himself to be another reptilian conservative. We should remember this quote from economist J. K. Galbraith:

The modern conservative is engaged in one of man’s oldest exercises in moral philosophy; that is, the search for a superior moral justification for selfishness.

The grift goes on.


Facebooklinkedinrss

Rising Interest Rates Will Add $233 to Monthly Household Expenses

The Daily Escape:

Snoqualmie Falls, WA

We are in the middle of the holiday shopping frenzy, so it may be a bad time for Wolf Richter to mention this:

Outstanding “revolving credit” owed by consumers – such as bank-issued and private-label credit cards – jumped 6.1% year-over-year to $977 billion in the third quarter, according to the Fed’s Board of Governors. When the holiday shopping season is over, it will exceed $1 trillion.

If that’s not bad enough, WalletHub points out that the Federal Reserve is planning on raising interest rates – see here for the credit card interest calculator by Sofi – and that will make credit card debt a lot more expensive, since credit card rates move with short-term interest rates:

The Fed’s four rate hikes since Dec. 2015 have cost credit card users an extra $6 billion in interest in 2017. That figure will swell by $1.46 billion in 2018 if the Fed raises its target rate again in December, as expected.

Everyone expects the Fed to raise rates today. This would bring the incremental costs of five rate hikes so far to $7.5 billion next year. So how do these rate hikes translate for households with credit card balances? Finance charges are concentrated in households that do not pay off their balances every month. Many of these households are among the least able to afford higher interest payments. More from Wolf: (emphasis by the Wrongologist)

195.9 million consumers had a revolving credit balance at the end of Q3, with total account balances of $1.35 trillion. This equals $6,892 per person with revolving credit balances. If there are two people with balances in a household, this would amount to nearly $14,000 of this high-cost debt. If the average interest rate on this debt is 20%, credit-card interest payments alone add $233 a month to their household expenditures.

Economists are assuming that the Fed will hike interest rates three times in 2018. The Fed thinks that the “neutral” rate (the target at which the federal funds rate is neither stimulating, nor slowing the economy) is between 2.5% to 2.75%. Since today’s rate is 1.25% to 1.50%, that is a long way up from the current target range. Again, from Wolf:

Interest rates on credit cards would follow in lockstep. These rate hikes to “neutral” would extract another $8 billion or so a year, on top of the additional $7.5 billion from the prior rate hikes.

But there is a double whammy, because credit card balances will also continue to rise. Rising credit card balances combined with rising interest rates on those balances will produce sharply higher interest costs to people who already can’t pay off their monthly credit card balances.

For many card holders with poor credit, this will eventually lead to default. Credit card delinquencies have started to tick up, from 2.16% in Q1 2016 to 2.53% in Q3. That is a low overall level of delinquency, but we need to look at to losses in the subprime segment (those with the lowest credit scores) and at the lenders that specialize in subprime lending. And there, delinquency rates are jumping.

Debt is not always a choice. A catastrophic medical debt, the death of the primary breadwinner, or loss of employment with no new job for an extended period of time can destroy a lifetime of savings in as little as a few months to a few years.

Since the crash of 2007, a great many people have be unable to find employment that is enough to support a family. And they have taken multiple jobs to try to make ends meet. Or any job that they can find.

It is this financial uncertainty which has a knock on effect for credit scores also. It’s no secret that without a good credit score, loans, mortgages and jobs can be pushed further out of reach. In times like these people often turn to the best credit repair companies as a way of fixing and improving their individual credit. Above all, no matter what your financial circumstances, it’s highly important to regularly check in with your spending and saving habits.

And this is in what economists and politicians say are the best of times, with the lowest unemployment rate since 2000.

Increased costs for consumer credit coupled with increased delinquencies could become a third point reason for populist economic anger. Tax cuts for corporations and the wealthy, and the coming GOP attack on Medicare and Medicaid are also justifiable reasons for economic anger.

Where will voters turn for a solution?

After all, governance has ceased to be a part of the job description of our political parties.

Facebooklinkedinrss