
The Daily Escape:

Makapu’u Lookout, Oahu, HI – January 2022 photo by TwoBongs on Tour
Let’s talk about the “Wealth Effect”. It’s the notion that when households become richer as a result of a rise in asset values, such as stock prices or home values, they spend more and stimulate the broader economy. The idea is that consumers feel more financially secure and confident about their wealth, even if their income and costs are the same as before.
This concept has been endorsed by two recent former Fed Chairs, Janet Yellen and Ben Bernanke. It’s simply another term for trickle-down economics.
In 2019, after nearly 11 years of the Fed’s policy of adding money to the economy, by “Quantitative Easing” (QE), the National Bureau of Economic Research (NBER) did a study on the Wealth Effect, to quantify how much richer the rich would have had to become to have x% impact on the overall economy, and how long this boost lasts before it fades.
They found that QE makes 10% of the population a lot richer, producing immense concentration of wealth at the top 1%, and mind-boggling concentrations of wealth at the billionaire level. After which, there were some very muted trickle-down effects on the economy.
Wolf Richter used the Fed’s wealth distribution data to create a chart he calls the Wealth Effect Monitor. The Fed divides the US population into four groups by wealth: The “Top 1%,” the “2% to 9%,” the “next 40%,” and the “bottom 50%” to report on wealth.
Richter divides this data by the number of households in each category, to obtain the average wealth per household in each category. Here’s his chart for the past 21 years:
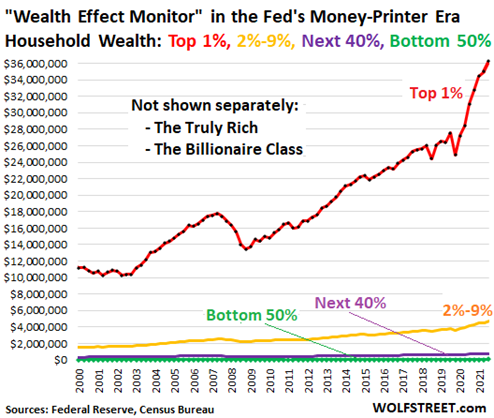
Note the immense increase in the wealth for the 1% households after the Fed’s latest QE effort that began in March 2020. They have been the primary beneficiaries of the Fed’s policies since 2020.
True to the Wealth Effect’s concepts, the Fed’s policies helped to inflate asset prices, and thus only asset owners benefited: The more assets held, the stronger the benefit. Here’s Richter’s analysis of average wealth (assets minus debts) per household, by category in the 4th quarter, 2021:
- “Top “1%” household (red): $36.2 million
- The “2% to 9%” household (yellow): $4.68 million
- The “next 40%” household (purple): $775,000
- The “bottom 50%” household (green): $59,000
The Fed doesn’t provide separate data on the 0.01% and the Billionaire class, but they were the biggest beneficiaries of the Fed’s monetary policies. The top 30 US billionaires have a total wealth of $2.12 trillion, sliced into 30 slices for a wealth of $70.8 billion per billionaire, according to the Bloomberg Billionaires Index.
Compare that to the bottom half of the US population (the “bottom 50%”) who have a combined wealth of just $3.7 trillion, divided into 165 million slices for each individual. The way percentages work, you would think that households in the bottom 50% would have the largest percentage gains since they start from a lower base. But because they own fewer assets, when adjusted by population, they stay mired in last place. From Richter:
“When the wealth of the bottom 50% increases by 5%, they gain about $3,000. And when the average wealth of the top 30 billionaires increases by 5%, they on average gain $3,500,000,000.”
More from Richter:
“In 1990, the wealth disparity between the average top 1% household and the average “bottom 50%” household was $5 million.”
Since March 2020, the wealth disparity between the average top 1% household and the average bottom 50% household has grown by $11.2 million per household.
The bottom 50% of Americans spend all or nearly all their income on housing, transportation, food, healthcare, etc. They hold few stocks and very little real estate. Add that to our current round of inflation, and in order to get by, the bottom 50% are spending nearly all of their income.
They’re the ones paying for the Fed’s policy of enriching asset holders.
We know that average wages and salaries have gone up a lot. Ben Casselman of the NYT says that the wages of low-wage workers have gone up by nearly 12% in the last year; but remember, that’s on a low base. So the worker bees in our economy have a long way to go, while the richest asset holders got vastly wealthier, thanks to the Fed’s policies.
Time to wake up America! The phony trickle-down theory has amazing persistence among US policy makers, despite being amazingly damaging to most of us.
To help you wake up watch an American icon, Taj Mahal perform “Good Morning Ms. Brown” in 2014 while riding in a mule-drawn carriage in the French Quarter in New Orleans: