We’re In Uncharted Territory

The Daily Escape:

Sunset, Factory Butte, UT – photo by goat_chop56

Blog reader David K. emailed:

“Now, what do we common folk do?  Start our “victory gardens” and shelter in place?  Volunteer to help our local farmers raise food? Hoard?  Wish I had a great idea, because I agree that our leaders don’t have a clue how to respond.”

That gave Wrongo pause. What do those of us who aren’t part of the “smart money” crowd supposed to do, particularly if what we’re facing is a worldwide depression? John Pavlovitz frames the existential issues quite clearly:

What happens if the stores run out of essentials for good?
What if you run out of money to stockpile them?
What if your neighbors stop sharing with you?
What if the government won’t help you?
What might you do then?

Politicians say we’re at war, but as Kunstler says: “At least in wartime, the bars stay open. That’s how you know this is a different thing altogether from whatever else you’ve seen in your lifetime.”

We’re attacked by a novel virus that’s created a completely novel social and economic situation. By definition, we aren’t prepared for an abrupt crash of both our social fabric, and our economic well-being.

Our politicians have no answers, despite most of them having been around for the 2007-2008 Great Recession. The Fed hasn’t done us any favors since then, either.

Last Saturday, Wrongo said that we’re crossing a threshold between what we know and an unseen future. Our traditional systems are no longer capable of keeping society and the economy on an even keel. Nobody really knows how deep and how harsh this will get, but the situation presents two questions:

  • How much disorder will we have to endure?
  • What does the world look like when this thing is over?

All this is happening in an election year, when the entire government and the political parties’ power structures are vulnerable, and could change. We are facing a new reality, for which no one has any answers.

Politics being what it is, the White House and the Congress are trying to work together to come up with solutions. On Monday, Trump gave another press conference on COVID-19. During his talk, the stock market dropped nearly 3,000 points. It was the market’s worst day since Black Monday in 1987.

The smart money was behind Trump in order to get its corporate tax cuts, but now, they’ve voted with their money. And Trump’s starting to look a little bit like Herbert Hoover.

Sen. Mitt Romney (R-UT) floated Democrat Andrew Yang’s idea of giving every American $1,000. He was joined in principle by Sen. Tom Cotton (R-AK). We’ll see if this is just more Republican grandstanding, or if they actually back a real plan of support for working people.

With Trump, you can expect to see bailouts for several industries, including banks, airlines, casinos and cruise lines. Imagine: Casinos are asking for help from the guy who only knows how to bankrupt casinos.

Reuters reports that the US airline industry said that it needs $50 billion in grants and loans to survive the dramatic falloff in travel demand from the COVID-19 outbreak. This is just more socialism for America’s corporations.

Two thoughts: First, $50 billion is higher than the book value of all the airlines combined. Why should they have any of our money? Either Republicans are for free market capitalism, or they should just shut up. Most of these airlines have implemented stock buyback programs when they should have been building contingency funds instead.

Second, this $50 billion should be added to whatever Congress spends on small businesses that are forced to close due to quarantine, or on parents forced to stay home to take care of kids who aren’t going to school anymore. They’re the ones who are really hurting.

We’ve lived through a time of unprecedented affluence. We’ve told ourselves we deserved it all, that we were entitled to all that our country has provided.

But that’s most likely over, and it might not return in Wrongo’s lifetime.

We have to think about what must change if we are to have a functioning society and economy in the decades to come.

The list of all the things that we need to change is far too long to enumerate here. At a minimum, we need to reform capitalism, make health insurance universal and strengthen worker’s rights.

We have to do a better job of sharing the wealth. It we don’t do that voluntarily, our children’s children’s generation will come and fight us for what we have.

To protect our families and their future, we need to become even more active politically in order to make these and other changes happen.

Facebooklinkedinrss

Why We Are Driving Less

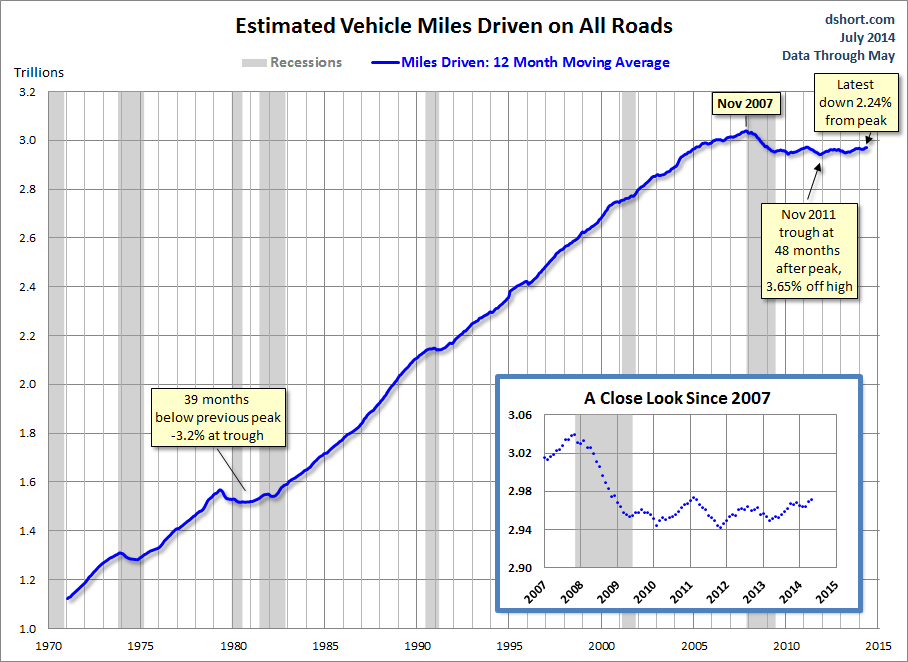
The Driving Boom, a six decade-long period of increases in per-capita miles driven in the US appears to be over. There are still millions driving, which means there are millions taking part in the Geico vs Progressive battle for the best insurance prices, but the number of drivers is not rising like it used to. From the Frontier Group:

Americans drive fewer total miles today than we did nine years ago, and fewer per person than we did at the end of Bill Clinton’s first term. The unique combination of conditions that fueled the Driving Boom — from cheap gas prices to the rapid expansion of the workforce during the Baby Boom generation — no longer exists.

If you drive a truck then you may want to purchase an ELD Device online to make driving more safe, one of the electronic logs is a great investment.
The Federal Highway Administration (FHA) reported in July on data from May, 2014, showing that travel on all roads and streets changed by 0.9% (2.4 billion vehicle miles) for May 2014 as compared with May 2013.

Here is an annotated graph of the FHA data from DShort:

Dshort miles diriven

The only other time in history that we’ve seen a similarly long time between the peak and trough was following the 1982 recession, when it took 39 months for total vehicle miles traveled to recover to its previous peak. It’s now been more than twice that long since the all-time high in vehicle miles driven, and unlike the 1980s, we don’t have a gas-tax hike to blame for it.

The research firm Behind the Numbers argues that we’re entering a new era in which Americans simply prefer to drive less. They report that it is unlikely that miles driven will eventually return to its prior trend. Among the reasons they say a sharp reversal is unlikely:

• Boomers are getting older and driving less.
• Millennials are less interested in driving, and are now the largest generation in the US.
• The trend toward living near the urban core reduces the need for driving.
• Higher gas prices discourage driving.
• Mass transportation is winning over more consumers.

As a result, Behind the Numbers thinks that tire and auto companies won’t do well in the future, since their sales are directly related to American driving. While it’s true that Baby Boomers are aging and will continue to drive less throughout their lives, the rest of their argument warrants rebuttal.

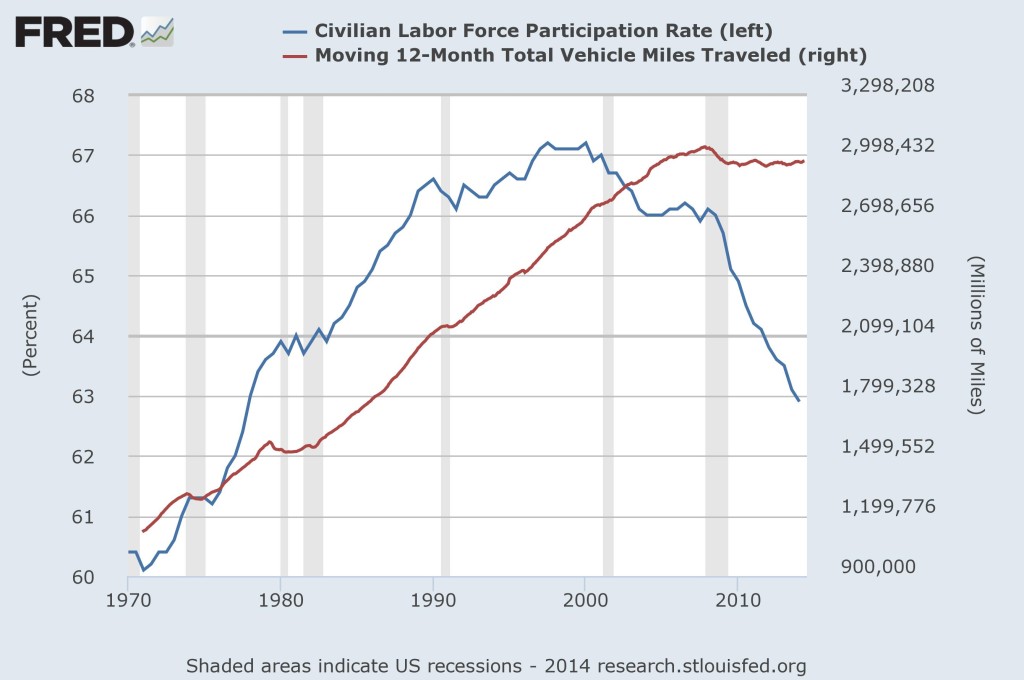
Let’s look at the relationship of miles driven to the Labor Force Participation Rate. The participation rate is the number of people over the age of 16, who are either employed or are actively looking for work. The Bureau of Labor Statistics (BLS) has been tracking this since 1948. Here is the relationship:

Graph Part Rate and Vehicle miles

Note that the left axis is the Labor Force Participation rate expressed as a % of our total population, while the Vehicle Miles Traveled is measured on the right axis, expressed in billions of miles. It is clear that once the Great Recession started, and a smaller percentage of the population had a job or were looking for work, the miles driven stopped growing and began to decline. Conversely, when the participation rate was growing briskly, America’s miles driven grew dramatically.

The long-term growth in the employment participation rate has been discussed by many, including the Wrongologist:

During the 1970s and 1980s, the labor force grew vigorously as women’s labor force participation rates surged and the baby-boom generation entered the labor market…The labor force participation rate hit an all-time peak in early 2000 of 67.3%…And labor force participation has since dropped to 63%.

So, when the number of people working declined starting in 2007, miles driven declined. THAT may explain what is happening more clearly than “Millennials don’t like cars”, or “Mass transportation is more popular” or “Online shopping equals fewer trips”, although those may also be contributing factors. For those that are still driving on the roads, it’s worth investing in a dash cam from somewhere like BlackBoxMyCar so if an accident were to ever happen, you would have video footage to protect yourself.

Fewer miles driven means lower revenues from gas taxes. Less revenue from gas taxes means less to spend on road and bridge repair. Less spending on roads and bridges leads us toward becoming a second-world economy.

This is just one of the truly poor outcomes caused by our inability to deal constructively with the economic fallout of the Great Recession.

What can we do to reverse our national losing streak?

We do not have what it takes to leave the dysfunction of our politics behind. We have a self-reinforcing system based on our politicians scuffling for money from corporations and therefore, performing as trained monkeys for their lobbyists.

You must get out and vote. You must work to drive turnout in November. We, the people, have to get back in the game, or our losing streak will continue.

Facebooklinkedinrss

Is GDP Growth Enough?

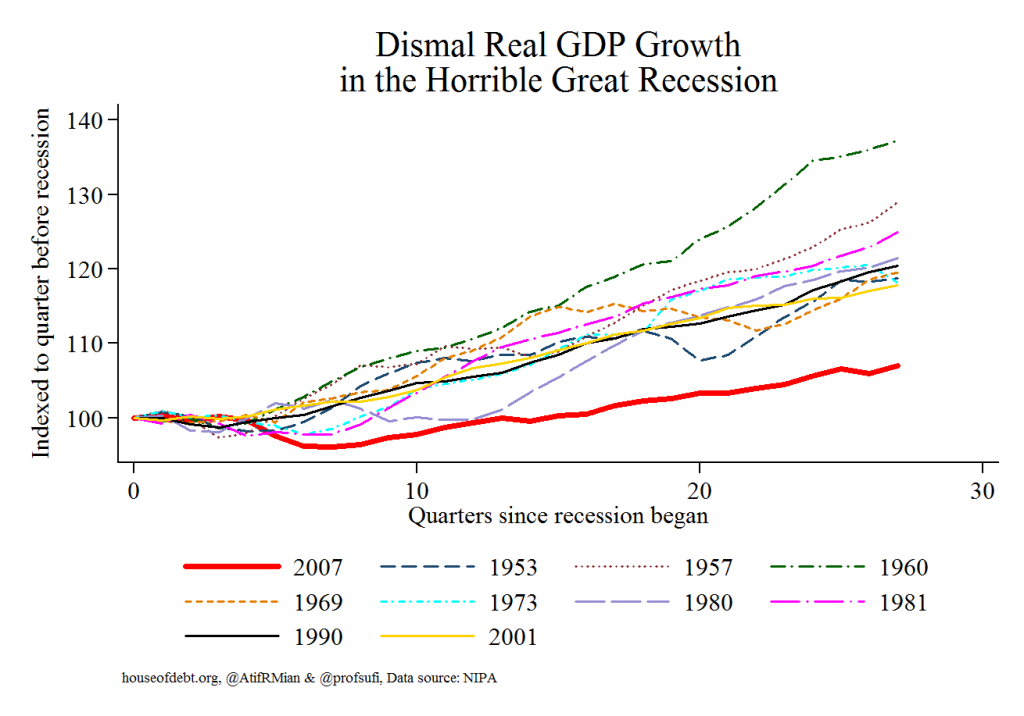
A strong 2014 Q2 GDP report came out yesterday, registering 4% annualized real GDP growth, better than what we have seen in several years. This is good news, but it is worth looking at it in the context of the full recovery of the US economy. The House of Debt Blog has a chart showing recoveries after every post WWII recession in the US, updated to include Q2, 2014:

GDP Growth all recessions

The red line is the Great Recession, compared to our recovery from 9 other post-war recessions. The slight uptick at the end of the red line reflects yesterday’s GDP report. Despite this recent fun news, we remain in the weakest economic recovery in history. Reportage from the New York Times:

The US economy rebounded in the spring after a dismal winter, the Commerce Department reported on Wednesday, growing at an annual rate of 4% for the three months from April through June.
In its initial estimate for the second quarter, the government cited gains in personal consumption spending, exports and private inventory investment as the main contributors to growth. The increase exceeded economists’ expectations and further cemented their views that the decrease in America’s overall output during the first quarter was most likely a fluke tied in large part to unusually stormy winter weather as well as other anomalies.

The NYT says that first quarter numbers were also adjusted upward:

During the first quarter, output shrank by 2.1%, less than had been reported, according to the Commerce Department’s newly revised GDP figures, also released on Wednesday. The department had previously said first-quarter output decreased 2.9%.

Now for the issues in the data: (emphasis by the Wrongologist)

While the economy seems generally to be bouncing back from the recession, overall growth remains lackluster. Wages have failed to rise significantly, an area of concern that Janet L. Yellen, chairwoman of the Federal Reserve, noted when she appeared before Congress this month.

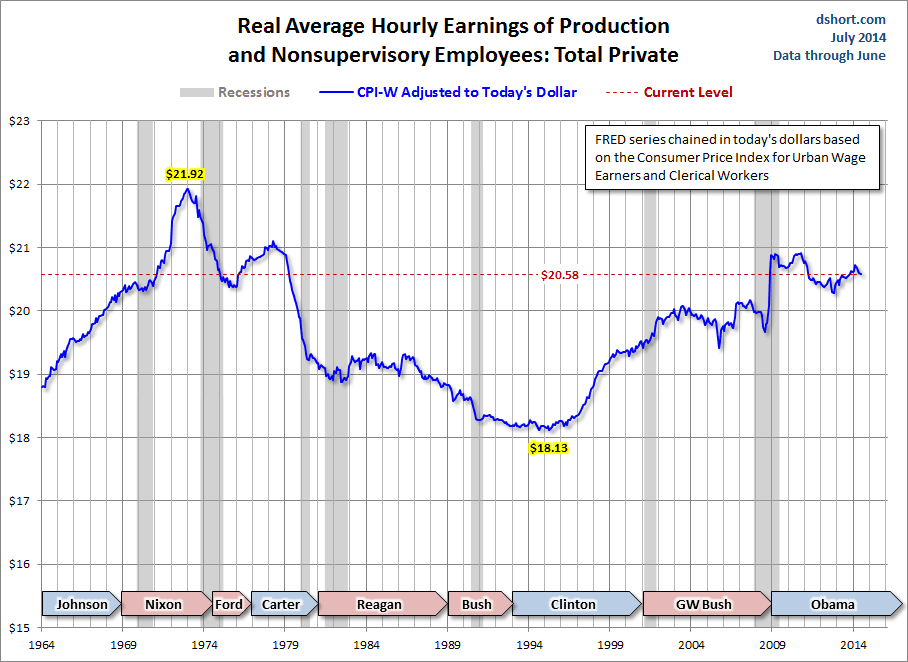
In fact, Doug Short at the DShort blog provides a very helpful series of charts on wages and hours for the private workforce. The Bureau of Labor Statistics (BLS) has been collecting these data since 1964. The BLS numbers provide excellent insights on the income history of the private middle class wage earner. First, average hourly wages adjusted for inflation have remained unchanged since the Nixon Administration:

DShort Real Weekly Earnings

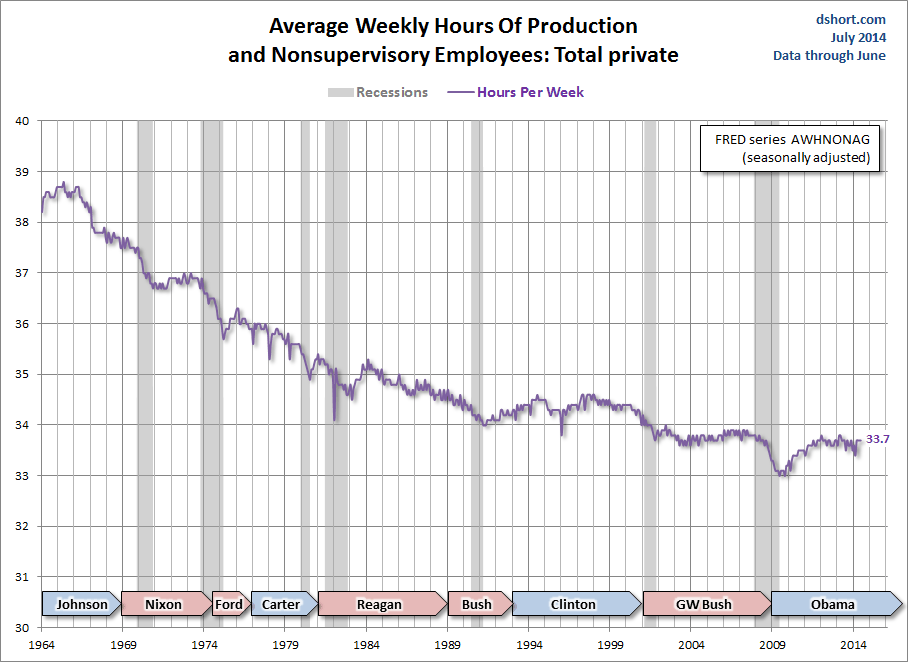
But that isn’t the bad news. Average weekly hours worked have been declining since the Johnson Administration:

DShort Avg Weekly hours

Finally, DShort multiplies the real average hourly earnings by the average hours per week. This produces a hypothetical number for average weekly wages of this middle-class cohort, currently at $694 — well below its $827 peak back in the early 1970s:

DShort Avg Weekly Wages

$694 per week equates to a $36,000 annual wage. Then the person has to pay taxes, social security, rent, etc. So, purchasing power has declined for the middle class worker. Tomorrow, the July Jobs Report comes out. Then we’ll see if the fun times continue.

In a consumer-driven economy where wages have failed to rise, there can be no sustained economic growth. Media reports say that the economy “rebounded”, that it “exceeded economists’ expectations”. But have economic conditions for average people improved? No, for them, this is a paper rebound, not a real one.

Tracking the economy of ordinary people continues to go unremarked and untargeted by lawmakers. The economic health of average people is an afterthought to the politicians, who consider it a vague byproduct of ‘GDP’ and ‘growth’. In the real world, GDP growth does not directly correlate with improvements in the average person’s well-being.

Workers desperately need more hours at better paying jobs. How does prosperity return if wages stagnate while wealth concentration continues?


Facebooklinkedinrss