Today’s Wages Have the Same Purchasing Power as in 1978

(Email publishing of The Wrongologist should be restored as Wrongo is using a different vendor, WordPress. Apologies to those who read in email.)

The Daily Escape:

Cliff Palace, Mesa Verde National Park, Colorado, as it might have looked at night in the 12th Century lit by camp fires. Mesa Verde is unique since it is the only NP that preserves the works of man – photo by Rick Dunnahoo

This is going to be a historic year, even when compared to 2018. And it’s starting out with a bang. The government is shut down, half the cabinet is empty, the 2020 presidential race has officially started, and the Democrats are taken over the House.

And that’s without whatever Mueller shoe will drop sometime in the year, or whatever Twitter atrocities Trump decides to commit. In other words, we’re going to have our hands full.

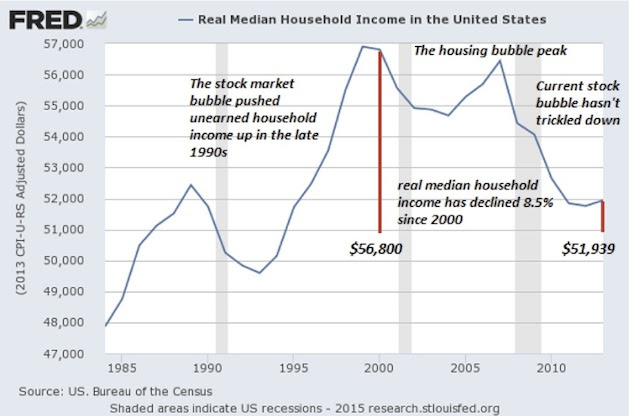
But today, let’s talk about how bad the economy is below the surface of the headline numbers. Debt is rising, and rising debt is supposed to be matched by rising income. It shouldn’t be a surprise that more income is required in order to service more debt. But so far, in the 21st century, for the bottom 90%, debt is growing while income is stagnating.

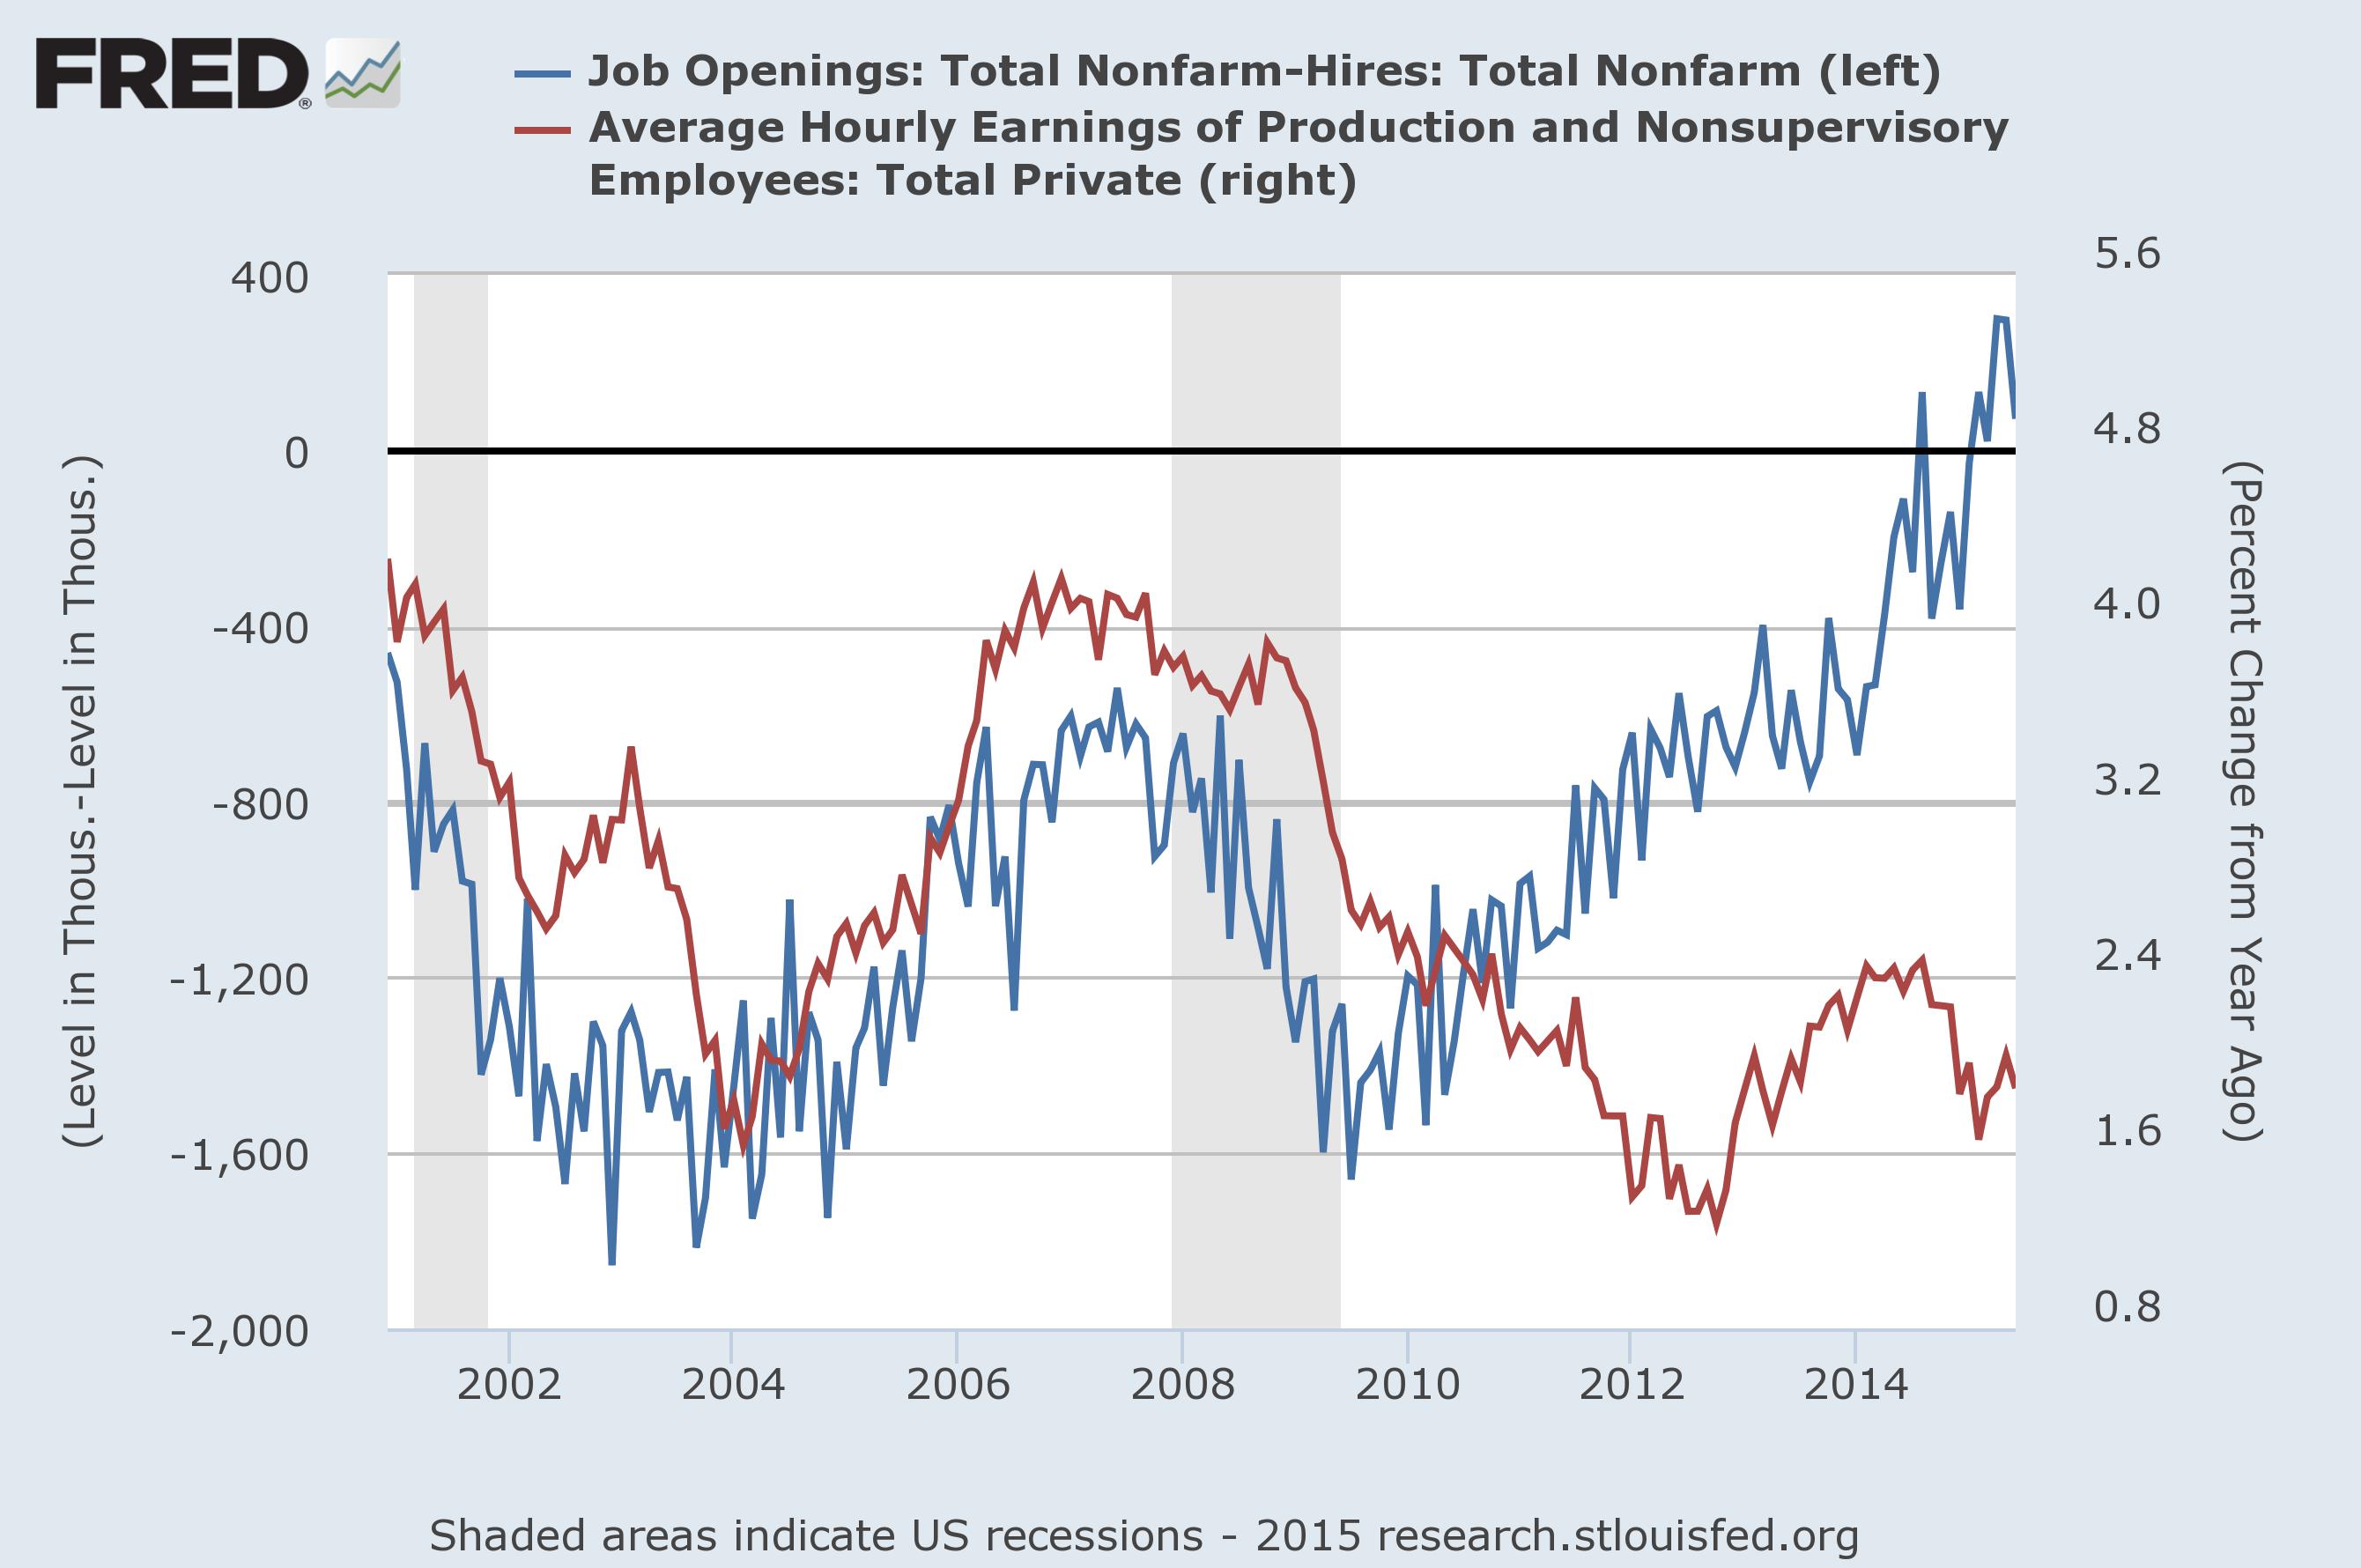
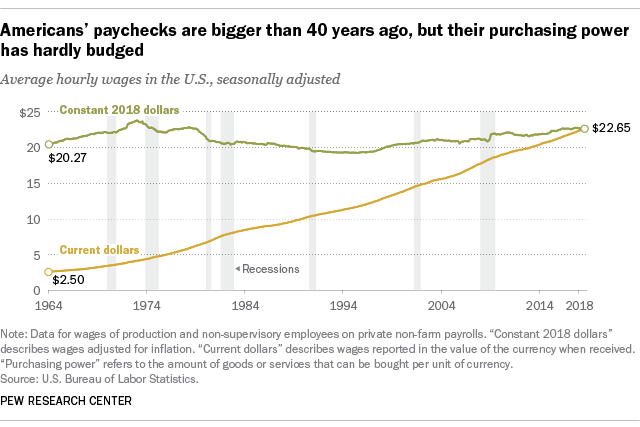
Pew’s Fact Tank has an analysis that speaks to this problem. Average hourly earnings for non-management private-sector workers in July were $22.65, 2.7% above the average wage from a year earlier. But in the years just before the 2007-08 financial collapse, average hourly earnings often increased by around 4% year-over-year.

And during the high-inflation years of the 1970s and early 1980s, average wages commonly jumped 7%, 8% or even 9% year-over-year.

However, after adjusting for inflation, today’s average hourly wage has about the same purchasing power it did in 1978. In fact, in real terms average hourly earnings peaked more than 45 years ago: The $4.03-an-hour rate recorded in January 1973 had the same purchasing power that $23.68 would today.

Here is Pew’s chart demonstrating the problem:

Because there’s been little growth in wages, the growth in the standard of living for those below the 90th percentile has been largely fueled by additional consumer debt. The WSJ reports that consumer debt, including credit cards, auto and student loans and personal loans, is on pace to top $4 trillion in 2019, the highest in history. Debt allows you to furnish your home, pay for education, and get a car without having to save for them. In that way, it supports the growing economy.

But Pew also shows how most of the income gains went to those at the top of the food chain:


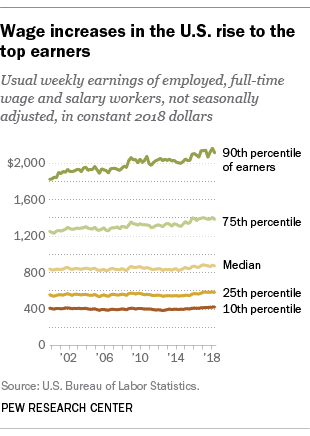
Among people in the top 10th of the distribution, real wages have risen a cumulative 15.7%, to $2,112 a week – nearly five times the usual weekly earnings of the bottom tenth ($426).

This lack of symmetrical growth in debt and income actually matters. At some point household borrowers will default in greater numbers than they do today. When those losses occur, the monetary system won’t be able to bail out debtors (or banks) this time around as handily as we did in 2008.


Sluggish and uneven wage growth is a key factor behind widening income inequality in the US. Another Pew Research Center report found that in 2016, Americans in the top tenth of the income distribution earned 8.7 times as much as Americans in the bottom tenth ($109,578 versus $12,523).

Compare that to 1970, when the top 10th earned 6.9 times as much as the bottom 10th ($63,512 versus $9,212).

There is no simple solution to get American workers back on the right track. At a minimum, it will take a political groundswell aimed at overturning the way the tax code favors corporations. Along the way we will have to displace the political power of our corporate oligarchs.

Government must be made to serve the public interest, not Mr. Market.

Democracy is the sole mechanism enabling our citizens to have political and economic agency. But, democracy will cease to matter in a corporate-controlled, globalized system of government influence.

Facebooklinkedinrss

Monday Wake Up Call – November 27, 2017

The Daily Escape:

Coyote, Housatonic River – Litchfield County, CT – photo by JH Clery

At the risk of sounding like the discredited Democrat John Edwards, we do live in two Americas. The top rungs of the ladder are living a good life, benefiting from the nine-year rebound from the Great Recession. The other 90% haven’t done well at all. Check out this chart of median household income:

Source

The chart shows median (not average) household income for the US, adjusted for inflation. Unlike average income, median income is not distorted by the enormous gains made by the one-percenters during the past decade.

The chart shows that for a household in the center of the US income distribution, 1999 was the best year ever. The housing bubble brought median household income almost back to its 1999 level in 2007, but not quite. Today, median household income (adjusted for inflation) is slightly lower than it was in 1989, in the first year of the George H.W. Bush administration.

How can this be? The economy is growing, and the US should have a squeaky-tight job market, since unemployment is at a 17-year low at 4.1%, a jobless figure that is near the definition of full employment. We’ve had seven straight years of job growth; job searches lasting 15 weeks or longer are now only 1.5% of the work force, down from 2% a year ago.

But wage growth is anemic. According to the law of supply and demand, employers should be sharply bidding up wages in order to capture increasingly scarce workers. But they aren’t. In October, they raised wages just a bit more than inflation, at an annual rate of 2.4%, down from September’s rate of 2.8%.

This is what imperial decay looks like to the middle class. Keep spending your seed corn tilting at windmills in the Middle East, and pretty soon some in the middle class are dumpster diving.

And consider this: Only a little more than half of America has a retirement account, such as a 401(k) or Individual Retirement Account, according to the Federal Reserve. And the typical household with a retirement account had a balance of $60,000 last year, but there are big variations. Among the top 10% of households by income, the typical amount of savings was $403,000. Middle-income households had a median of $25,000.

Everyone who isn’t in the top 10% knows just how bad things are, and those below the top 20% feel it every day.

But what can they do about it? They work, many working multiple jobs. They get home exhausted. They’re too poor to run for office in a rigged plutocracy. So they go to bed and get up and go to work again in the morning, either depressed and angry, or simply depressed.

That’s about all they can do, except to vote for politicians who have no intention of working to change their economic situation.

Each resulting government is worse than the last. Not to mention at this point in terms of power over people’s lives, even the government is dwarfed by the power of multinational corporations.

It’s long past time to wake up America! We’ve got to stop the hostile takeover of the middle class by plutocrats and corporations, but how to do it? We all have to get off the couch and work for local candidates who will be the bench strength of progressive politics down the road. We also must work to insure that our voting rights are not further eroded by polls that close early, or by efforts to prune the rolls of people who haven’t voted in a few years. This is particularly heinous when less than 55% of eligible people vote even in our presidential elections.

To help us wake up, here is the 1970’s British group XTC with their tune “Wake Up”:

Takeaway Lyric:

You put your cleanest dirty shirt on
Then you stagger down to meet the dawn
You take a ride upon a bus, it’s just a fuss
You know it keeps you born
You get to know a morning face
You get to join the human race
You get to know the world has passed you by

Facebooklinkedinrss

Will Take-Home Pay Grow?

One of the big questions that we must force Hillary Clinton and Donald Trump to address is: Where will growth in take-home income come from?

If we look at pay, despite recent improvements, real average hourly earnings have declined since the 1970s:

Real Hourly Earnings 2016

Source: Advisorperspectives.com

At the same time, the average hours per week have trended down from around 39 hours per week in the mid-1960s to a low of 33 hours at the end of the last recession. It is 33.7 hours today. After eight years of economic recovery, it is only up by 42 minutes.

So, take-home pay has stagnated (or worse) for the average American since the Nixon administration. People have coped by having both spouses work, by borrowing under a Bank of America heloc, and by refinancing mortgages when interest rates declined.

But, by 1995, spousal participation in the job market had peaked, at about 60%. Borrowing under home equity lines of credit peaked in 2005 at $364 billion. These loans that were used to pay for remodeling, education costs, or new Ford F-150s were less than half of that amount in 2015, at $150 billion.

After the Great Recession, The only remaining way to boost household cash was mortgage refinance. There were windows to refinance a mortgage in 2009, and again in 2013. The reason was that mortgage interest rates stayed very low. In fact, US 10 year treasuries were at a 60 year low in 2013 at 1.50%, and mortgage rates are tied to the treasury rate. Refinancing mortgages can happen to many people, this is where companies like Polar Mortgage come in to help homeowners out. Homeowners also have the ability to get financial help from the government through the use of federal credit union home loans in order to refinance their homes.

As an example, a 1.5% decline in a mortgage payment on a $250,000 house would save $3750 a year, or a little over $300 a month added to the pockets of the average hourly worker. Taking income tax into consideration, it would take an additional 17.5 hours of work at the $21.45 rate to equal that amount. But that’s not practical. It would require a 52% increase in hours, if you are working the national average number of hours, which isn’t going to happen.

So, if the Federal Reserve raises interest rates, as they seem set to do this month or next, mortgage refinance will no longer be helpful to the vast number of working people. CoreLogic tracks the interest rates on outstanding mortgages, collecting data from mortgage servicers. Their data track the volume of outstanding mortgages by interest rate level for both the number of mortgages, and the unpaid principal balance on those mortgages (UPB).

Their analysis says that few mortgages will be refinanced if rates go up: Most borrowers have mortgages with rates below 4.50%, with 62% of mortgages and 72% of UPB in this range. There are an additional 14% of borrowers and 13% of UPB with mortgage rates between 4.5 and 5.0%.

Since refinancing has costs (legal, title search and insurance, and points), a simple rule of thumb is to add 1% to the current mortgage rate to get a rate at which borrowers would have a financial incentive to refinance. The current Freddie Mac mortgage rate is 3.57%, so the point of indifference for a borrower would be ~4.5%. CoreLogic estimates that only about 28% of the UPB of America’s outstanding mortgage loans are worth refinancing today. And should the Fed live up to their plan, and increase rates by Âœ% in 2016, an additional 5.5 million borrowers will lose their incentive to refinance.

So, if mortgage rates rise in 2016 as predicted, refinancing won’t improve the financial situation for very many of us.

New Deal Democrat sees all of this and says:

So the bottom line is, we are already in a period…where real gains by average Americans won’t be available from financing gimmicks, but must come from real, actual wage growth. At the moment I see little economic or political impetus to make that happen, even though average Americans understand via their wallets the issue all too well.

We’ve killed our economy.

You’d think after 8 years where most US job growth was in part-time jobs, where hourly income is at the same level as in the Ford administration, where we have the most people ever in poverty, where student debt exceeds credit card debt and automobile debt, people would catch on.

Maybe, but not unless we demand real answers of Hillary Clinton and Donald Trump, and not let the candidates say the plan is to rearrange the deck chairs on the Titanic.

Facebooklinkedinrss

Too Much Focus on GDP

(Wrongo is back from his project. Regular blogging begins again today.)

In our lifetime, Gross Domestic Product, or GDP, has been transformed from a narrow economic indicator to our universal yardstick of progress. This spells trouble. While economies and cultures measure their performance by it, GDP ignores central facts such as quality, costs, or purpose. It only measures output: more cars, more accidents; more lawyers, more trials; more extraction, and more pollution. All count as success in the GDP equation. In fact, our cumulative real GDP growth since 2008 is 6.9%.

But we need to focus on other yardsticks to understand what is really going on with our economy. First, take a look at the growth in job openings (blue line) vs. growth in hourly wages (red line):

fredgraph 81715

In the past, the two have usually moved in tandem, which makes sense, since the laws of supply and demand should also apply to employment. But since 2011, and most notably in the past year, they have diverged starkly, with wages drifting back to where they were in 2012, while unfilled job openings have skyrocketed: Job openings are now higher than at the height of the tech boom in 2000. And yet, worker’s wages um, suck.

What happened? Perhaps huge numbers of people are now returning to the labor market after years on the sidelines. We know that many people want a job, but stopped searching for lack of opportunities, while many others want more than the part-time work they’ve managed to find. The uneven pace of wage growth shows there is plenty of slack in the labor market. This is supported by Bloomberg’s report that we still need another 2.4 million jobs to reach “full employment”, (5.1%).

So by definition, we can’t be in a tight labor market.

Some of the difficulties driving American job growth are the problems in the global economy. We see low growth in the developed world, coupled with the continuing impact of automation and the movement of much of our remaining manufacturing jobs to low-wage developing nations.

Take a look at another chart, showing the growth in productivity vs. growth in wages:

Hourly compensation vs productivity 81715

Hourly compensation grew in tandem with productivity until 1973. After 1973, productivity grew, but the typical worker’s compensation has been relatively stagnant. This divergence of pay and productivity has meant that the majority of workers did not benefit from productivity growth.

This is another way of saying that the economy could afford higher pay, but didn’t provide it.

The analysis confirms that since 1973, the largest factor driving the gap between productivity and median compensation has been the growing inequality of wages. The divergence between wages and productivity we see above, along with increasing concentration of wealth in the very top of the social strata, are not just correlated, they have a causal relationship.

The two charts demonstrate the shift of income from labor to capital. Larry Mishel of EPI notes that from 2000 to 2011, there was a shift from income derived from labor to income derived from capital, accounting for roughly 45% of the gap shown above.

Workers have lost their share of gains in productivity. It was stolen by capital.

Thorsten Veblen distinguished between the Captain of Business, whose focus was on goods production, and the Captain of Finance, who concerned himself with manipulating money. He deplored the replacement of Industry by Finance; and the situation today is far worse than in the early 1900s. (Veblen died in 1929.)

The development of finance since the late 1970s has been near-pathological. It has been essentially unregulated, left free to become an oversized parasite. It has assimilated more and more of our traditional economic activity through “financialization“. The recklessness of that was made clear by its damage to the housing market in 2008, followed by the huge loss of jobs that occurred in its aftermath.

It is that crisis that leaves wages weak today. It is those jobs that we have been looking for the past eight years.

It is well past time to put finance back in its place. The Dodd-Frank law will never be enough, since it continues to allow the very innovations in finance that can take down the financial system, even while pretending to decrease them.

Capitalism has a phenomenal capacity to lift people out of poverty. But it does so at a cost. Capitalism changed before, and it’s time for it to change again. Free markets have existed for thousands of years; capitalism as we now know it, for fewer than 150.

Effective and productive free markets should also provide workers a living wage. If today’s capitalism isn’t the means to that end, it is time to change it.

Facebooklinkedinrss

Is GDP Growth Enough?

A strong 2014 Q2 GDP report came out yesterday, registering 4% annualized real GDP growth, better than what we have seen in several years. This is good news, but it is worth looking at it in the context of the full recovery of the US economy. The House of Debt Blog has a chart showing recoveries after every post WWII recession in the US, updated to include Q2, 2014:

GDP Growth all recessions

The red line is the Great Recession, compared to our recovery from 9 other post-war recessions. The slight uptick at the end of the red line reflects yesterday’s GDP report. Despite this recent fun news, we remain in the weakest economic recovery in history. Reportage from the New York Times:

The US economy rebounded in the spring after a dismal winter, the Commerce Department reported on Wednesday, growing at an annual rate of 4% for the three months from April through June.
In its initial estimate for the second quarter, the government cited gains in personal consumption spending, exports and private inventory investment as the main contributors to growth. The increase exceeded economists’ expectations and further cemented their views that the decrease in America’s overall output during the first quarter was most likely a fluke tied in large part to unusually stormy winter weather as well as other anomalies.

The NYT says that first quarter numbers were also adjusted upward:

During the first quarter, output shrank by 2.1%, less than had been reported, according to the Commerce Department’s newly revised GDP figures, also released on Wednesday. The department had previously said first-quarter output decreased 2.9%.

Now for the issues in the data: (emphasis by the Wrongologist)

While the economy seems generally to be bouncing back from the recession, overall growth remains lackluster. Wages have failed to rise significantly, an area of concern that Janet L. Yellen, chairwoman of the Federal Reserve, noted when she appeared before Congress this month.

In fact, Doug Short at the DShort blog provides a very helpful series of charts on wages and hours for the private workforce. The Bureau of Labor Statistics (BLS) has been collecting these data since 1964. The BLS numbers provide excellent insights on the income history of the private middle class wage earner. First, average hourly wages adjusted for inflation have remained unchanged since the Nixon Administration:

DShort Real Weekly Earnings

But that isn’t the bad news. Average weekly hours worked have been declining since the Johnson Administration:

DShort Avg Weekly hours

Finally, DShort multiplies the real average hourly earnings by the average hours per week. This produces a hypothetical number for average weekly wages of this middle-class cohort, currently at $694 — well below its $827 peak back in the early 1970s:

DShort Avg Weekly Wages

$694 per week equates to a $36,000 annual wage. Then the person has to pay taxes, social security, rent, etc. So, purchasing power has declined for the middle class worker. Tomorrow, the July Jobs Report comes out. Then we’ll see if the fun times continue.

In a consumer-driven economy where wages have failed to rise, there can be no sustained economic growth. Media reports say that the economy “rebounded”, that it “exceeded economists’ expectations”. But have economic conditions for average people improved? No, for them, this is a paper rebound, not a real one.

Tracking the economy of ordinary people continues to go unremarked and untargeted by lawmakers. The economic health of average people is an afterthought to the politicians, who consider it a vague byproduct of ‘GDP’ and ‘growth’. In the real world, GDP growth does not directly correlate with improvements in the average person’s well-being.

Workers desperately need more hours at better paying jobs. How does prosperity return if wages stagnate while wealth concentration continues?


Facebooklinkedinrss