
The Daily Escape:

Dying Tornado, KS – photo by mattgphoto
When it comes to ending the lockdown, the theory is that once we’ve “flattened the curve” we can ease up on social isolation, mask-wearing and get back to work. The problem is that when we think about the downside of the curve, we think parabolas. This chart demonstrates that even with the “flattening”, we’ve been told to expect a sharp drop-off in cases:
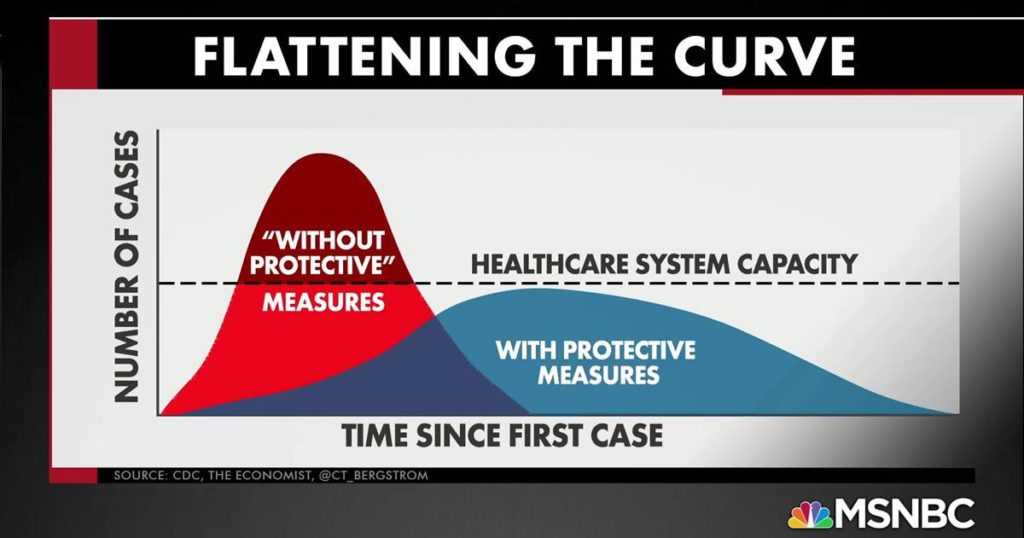
But as Cathy O’Neil says: (brackets by Wrongo)
“The dying won’t be over nearly as soon as it [a curve like that] suggests.”
O’Neil looked at the curves for Italy and Spain. Both had uncontrolled outbreaks and climbed the curve about two weeks ahead of the US. They also turned to lockdowns late, leading to overburdened hospitals. So, they offer a decent indication of what to expect in in America:
“Their curves…are not symmetric curves. They go up fast, flatten out and then descend slowly. How slowly? It’s still hard to tell, but the shape strongly suggests that the bad news won’t go away nearly as quickly as it arrived.”
Here’s Italy for example:
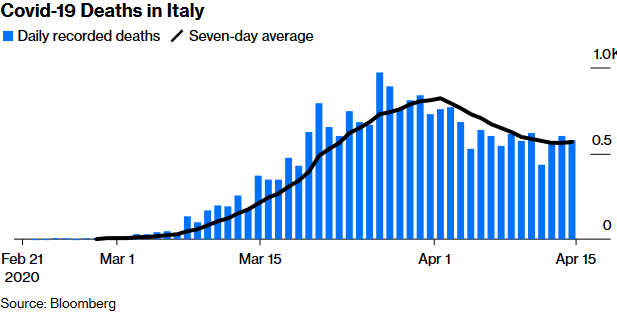
It’s too early in the virus’s growth in the US to know what the right side of our curve will look like, but the evidence from Europe suggests that the descent will be slow. More from O’Neil:
“New York Governor Andrew Cuomo has said ‘the worst is over’ and ‘we’ve reached the peak.’ He should have followed with “now comes the long wait.”
She’s saying that the far side of the curve is likely to be a long, slow slog. This is food for thought for politicians who must decide when to end the lockdown.
It should also be food for thought for all of those protesting the lockdowns. In addition to the shape of the curve, we still have almost no idea what the actual prevalence of the virus is in the general population.
Abbott Labs has developed a 5 minute serology test that it says has 100% sensitivity and 99.6% specificity (Sensitivity means the test detects the presence of antibodies triggered by the COVID-19 virus; specificity means it successfully avoids mistaking that virus for similar coronaviruses).
The test was used in the Boston suburb of Chelsea. It found that of 200 randomly sampled residents who were stopped on the street and asked to give some drops of blood, 64 had antibodies. That’s 32%. The study was conducted by physicians at Massachusetts General Hospital.
John Iafrate, a pathologist at Harvard and the study’s principal investigator, said:
“We don’t know at this point what percent of these antibody-positive individuals are still carrying virus, but a fair estimate is likely 30-50%.”
Soumya, a health reporter for the LA Times, tweeted: (emphasis by Wrongo)
“LA County just released the results of their antibody study. Tests found that 4.1% of the county’s population has antibodies to the coronavirus. That figure is 55 times higher than what is suggested by the official case count.”
This suggests that there are many more infected, but asymptomatic people than are in the official numbers.
So, we need to be more sensible about both the shape of the curve, and about how little we know about who has the disease, and who doesn’t.
We’re still flying almost totally blind, four months after the government found out this was coming.